Plotting climate data
Topic: Climate of Places: Tropical, Temperate and Dry Places in Australia
This is the student activity 1 of 4 of the Places are similar and different: climate of places learning activity.
Task No. 1
Plotting climate data
Choose two places from the below list. Using the data from the Bureau of Meteorology Climate data website, complate the average monthly rainfall and average monthly temperature tables in the downloadable resource.
- Barron River, Qld (Cairns)
- Darwin, NT
- Enngonia, NSW (Bourke)
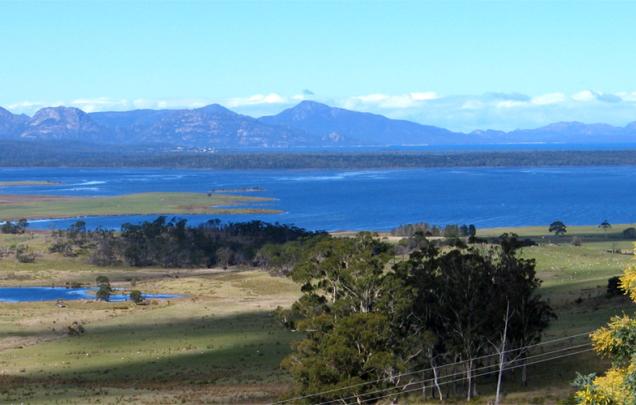
- Oyster Bay, Tasmania (Swansea)
Using the data from your average temperature and rainfall tables, create a column graph to represent this information.
Task No. 2
Interpreting Climate data
Using the information you collected in the previous task, fill in the comparison table in the downloadable resource.